
February was another positive month for the Fintax Funds with Growth adding 3.3% and Balanced adding 2.7% bringing the year to date returns to 12.9% and 10.7%, respectively. Rolling 12 months have improved markedly, given the sharp decline global markets experienced during the latter part of last year, with Growth now at -2.8% and Balanced at -1.7%.
The Curious Case of the African Growth Story
2000 2011 2013
…………. 2019
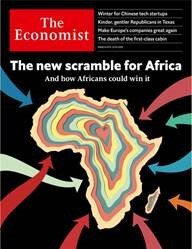
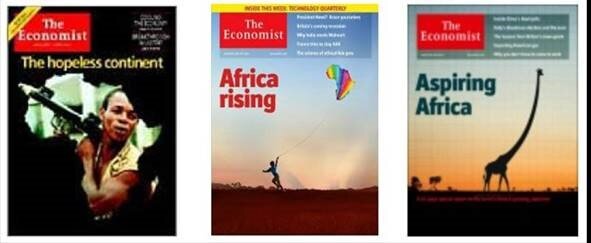
A relatively good gauge of what is going on with general market psychology is to establish what is making global news headlines. The most recent issue of The Economist magazine, for example, displays a cover of and a feature on “The new scramble for Africa”.
Just looking at the cover, and imagining the story, you would have thought that foreign investors are flocking to the continent with bags full of money, and that this would lead to excellent future local stock market returns. However, not too long ago (in 2000), the same magazine was not as positive about Africa’s prospects. Counterintuitively, if you were to have invested then (when expectations were low), your returns from the South African All Share Index (ALSI), would have outperformed many major market indices. Not too bad for a small country on the tip of “the hopeless continent”.
Since that cover, however, The Economist changed its tune and started touting a “rising” and “aspiring” Africa and most recently “The new scramble for Africa”. What have the returns been for investors since the positive headlines first appeared?
The refocus on the prospects for growth on the African continent may have been positive for its people, but less so for investors in Africa, relatively speaking. Below is a table showing the relative size of each country’s stock market as a proportion of the global stock market. It compares the current proportion relative to the proportion ten years ago:
| Country | % World | 10 Yrs Ago | 10-Yr Change | Country | % World | 10 Yrs Ago | 10-Yr Change |
| United States | 40.01 | 32.34 | 7.67 | Russia | 0.70 | 1.45 | -0.75 |
| Japan | 7.59 | 8.02 | -0.43 | Thailand | 0.65 | 0.31 | 0.34 |
| China | 7.51 | 4.03 | 3.48 | Singapore | 0.64 | 0.82 | -0.18 |
| Hong Kong | 6.51 | 5.56 | 0.95 | Saudi Arabia | 0.62 | 0.96 | -0.34 |
| UK | 4.49 | 6.83 | -2.34 | South Africa | 0.62 | 0.79 | -0.17 |
| France | 3.23 | 4.44 | -1.21 | Indonesia | 0.58 | 0.37 | 0.21 |
| Germany | 2.91 | 3.62 | -0.71 | Denmark | 0.57 | 0.53 | 0.04 |
| India | 2.83 | 2.23 | 0.60 | Malaysia | 0.55 | 0.49 | 0.06 |
| Canada | 2.81 | 3.66 | -0.85 | Belgium | 0.54 | 0.58 | -0.04 |
| Switzerland | 2.03 | 2.24 | -0.21 | Mexico | 0.49 | 0.80 | -0.31 |
| South Korea | 1.97 | 1.58 | 0.39 | Norway | 0.42 | 0.71 | -0.29 |
| Australia | 1.72 | 2.42 | -0.70 | Finland | 0.35 | 0.55 | -0.20 |
| Taiwan | 1.48 | 1.33 | 0.15 | Chile | 0.34 | 0.40 | -0.06 |
| Sweden | 0.97 | 0.94 | 0.03 | Philippines | 0.33 | 0.15 | 0.18 |
| Spain | 0.94 | 1.72 | -0.78 | U.A.E | 0.31 | 0.40 | -0.09 |
| Brazil | 0.90 | 2.57 | -1.67 | Israel | 0.22 | 0.34 | -0.12 |
| Italy | 0.84 | 1.74 | -0.90 | Poland | 0.21 | 0.35 | -0.14 |
| Netherlands | 0.79 | 0.80 | -0.01 |
Source: Bloomberg USD Indices.
The South African equity market is the only market in Africa that features globally on the list (stock markets in Nigeria, Egypt, Namibia, Zambia and Zimbabwe are minuscule on a global basis). You’ll notice that the South African equity market’s relative size has actually declined as a proportion of the global equity market over the last ten years. In effect, some foreign stock markets gained at its expense. Relatively speaking, if you were invested 100% in South Africa ten years ago, you would be poorer today (in USD terms) than what you would have been were you 100% invested in, for example, the US. In fact, some smaller countries (in terms of global equity market weighting, like Thailand & the Philippines) actually doubled the size of their contribution to the global stock market over this timeframe.
So whilst there are always good stories to tell about a country, region or continent’s economic growth prospects, the reality is that you still have to find investments that offer good value. A good story (like good economic growth prospects) and good investment returns are not necessarily positively correlated (Dimson, Marsh & Staunton have an excellent study on this which we are happy to share for those interested). In fact, it is about finding good investment opportunities when there are low expectations that tend to deliver the best returns. This is when favourable mispricing opportunities tend to develop. Given all the noise out there, separating fact from fiction is the investor’s most difficult challenge.
The independent London advisory team continue to carefully scour the world’s markets to establish the facts that would contribute to our investors’ investment returns instead of relying on popular stories.